Submitted by WESPAC ADVISORS, LLC on October 23rd, 2015
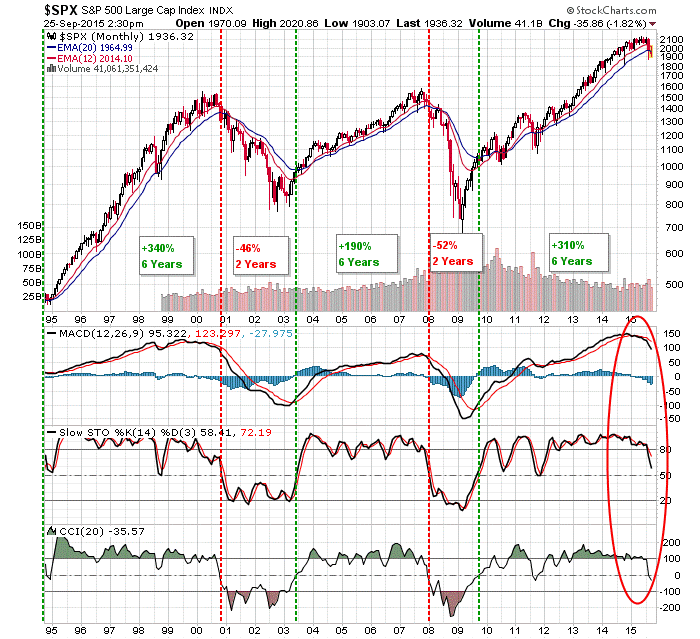
- Since 1995, the crossover of the 12-month EMA and the 20-month EMA have been reliable indicators of trend; while not perfect timing indicator for tops and bottoms, following this simple metric would keep investors on the right side of the trend. Of course, there is no way to know whether this will hold true in the current cycle.
- The S&P 500 has only traded below its 20-month EMA for two consecutive months 5 times since 1995; three of these were short-lived affairs (1998 Currency Crisis, 2010 Flash Crash, and 2011 Debt Ceiling Crisis) and two were the beginning of the 2000 Bear Market and the 2008 Bear Market.
- The S&P 500 is now trading below its 20-month EMA (1964) and the 12-month EMA is in a negative slope and rapidly approaching a crossover (now 2015).
- Monthly S&P 500 momentum indicators are flashing red with a MACD bearish reversal, a STO reversal, and a CCI reversal.
- While this may just be a short-lived challenge as it was in 1998, 2010 and 2011, it is interesting to note that this is occurring around 6 years after the bull market reversal – that is the around the same duration as the bull cycles of 1995-2000 and 2002-2007.
- Caution is certainly warranted if the S&P 500 continues to trade under these important long-term moving averages.