![]()


Fed Minutes Drive S&P 500 over its 50-day EMA for Second Day
- The S&P 500 has been submerged with a fairly negative trend setup since the August selloff, experiencing the death cross of the 50-day below its 200-day and trading below the important longer-term 12-month and 20-month EMAs.
- Recent price action had the appearance of a bottom, but the S&P 500 became mired in a volatile sideways trading range since August 21rst, failing to even test its breakdown point in the 2040 range.
- On the heels of the release of the Fed minutes from their September meeting, the S&P 500 rose above its 50-day EMA for the second day in a row, pressing the top of the trading range; if the S&P 500 can hold this breakout, it will likely attract buyers looking to play fourth quarter seasonal statistics.
- Over the past 20 years fourth quarter has had positive gains in the equity markets 80% of the time with an average gain of +4.96%; over the past 6 years this has improved to an 83% win rate and an average gain of 6.6%,
- While October has historically been the weakest in fourth quarter, over the past five years October has been up 80% of the time with an average gain of +3.86%; even if you throw out the wild +10.79% snap back rally in 2011, October has still averaged a solid +2.13% average gain.
- The S&P 500 has already snapped back +4.8% month-to-date.
- The S&P 500 has now had gains 7 of the past 8 days and has gotten a little overbought on a short-term basis; it would not be surprising to see more volatility in October.
- Given the violent bounce from the September 28th low and the fourth quarter seasonal patterns, any downside volatility in October is likely to be heavily bought.
- There are several important cautions, as always:
- Third quarter earnings season is in full swing and there have been some notable misses and stock volatility.
- The Fed continues to promote a rate hike and the end of ZIRP in their December meeting -- this could easily be a source of downside volatility.
- There is heavy technical resistance in the 2040-2085 range that could easily stall any rally.
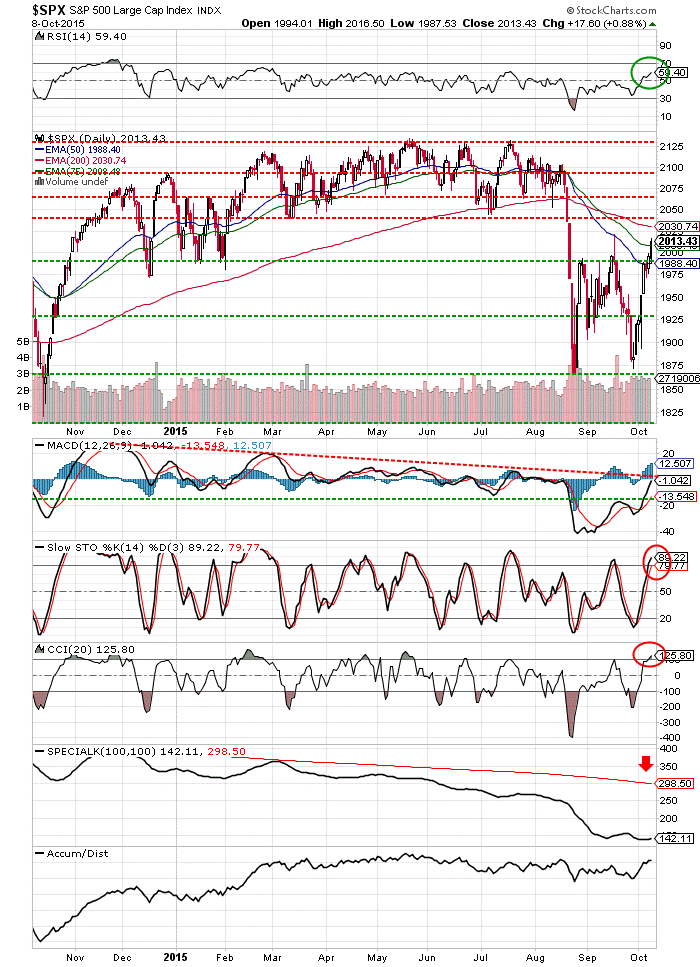
The S&P 500 has cleared its 50-day EMA for the second day. It is typical to look trading above an EMA to last 3-5 days before one concludes it is a breakout. Next resistance will be the 200-day EMA and the breakdown point in the 2030-2040 range. If the S&P can clear those levels, upside pressure will certainly accelerate. Next resistance levels are in the 2085-2100 range. Note that the faster momentum indicators like the CCI and STO have reached overbought levels with this 8 day +4.8% move.
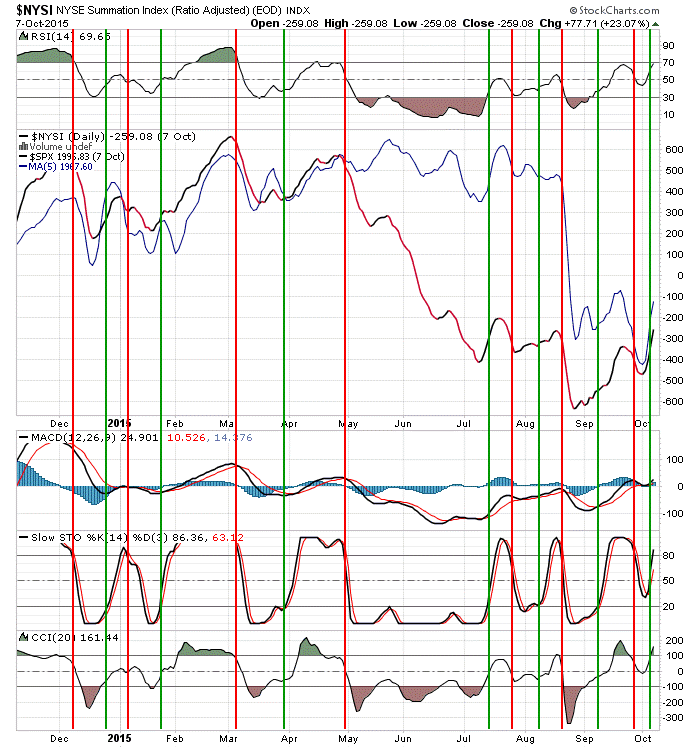
The Summation Index is a fairly reliable indicator of market cycles; a non-confirmed reversal as we just experienced happens periodically, but not often. There is still room to the upside in the momentum indicators for the Summation Index.